What is the Purpose of a Dashboard?
A dashboard is an information management tool that receives data from a linked database to provide data visualizations. The main use of a dashboard is to show a comprehensive overview of data from different sources. Dashboards are useful for monitoring, measuring, and analyzing relevant data in key areas.
When executed well, it also becomes the single source of truth for your organization. Instead of having to spend hours upon hours looking through different tools’ reporting features or various spreadsheets, you can find what you need in one dashboard.
This also means that you can use to identify trends and patterns that you might be able to capitalize on or course-correct before it is too late.
What Is the Difference Between a KPI Report and a KPI Dashboard?
While an interactive KPI report you can use to navigate through different metrics and perform data exploration and analysis is fairly similar to modern KPI dashboards, they’re not necessarily the same thing. Traditional KPI reports are static documents distributed to shareholders, while interactive dashboards allow for much easier access to different layers of information.
KPI reports focus on the analytical interpretation of metrics mostly via tables and graphs that make decision-making easier. On the other hand, dashboards are visualization tools that can support KPI reports that’s to say they employ various visual formats like graphs and charts that give real-time insight into KPI and metric performance.
What Is a KPI Report?
A KPI report is a performance tracking tool that allows you to quickly analyze key performance indicators and understand how your organization is doing with respect to specific goals. They include data visualization, consisting of charts, tables, and graphs. Modern KPI reports are interactive, and all the underlying data can be accessed quickly.
Why Are KPI Reports Important?
KPIs are more than just numbers or even metrics. They make it possible to understand how your business is performing, allowing you to make adjustments in your procedures and achieve your long-term goals. Identifying the right KPIs and measuring them will help you achieve results more quickly, and you’ll have a better insight into how well you did.
A well-made KPI report with an organized dashboard provides important insights in an easy-to-understand format, allowing everyone to understand the overall situation that’s to say even non-technical personnel can recognize relationships between data points and identify trends.
KPI Reporting Examples:
Of course, there are countless possible reports you can make, all depending on what you’re trying to achieve, the type of organization, and the target audience. Here are examples of some of the most common KPI reports you might need to make.
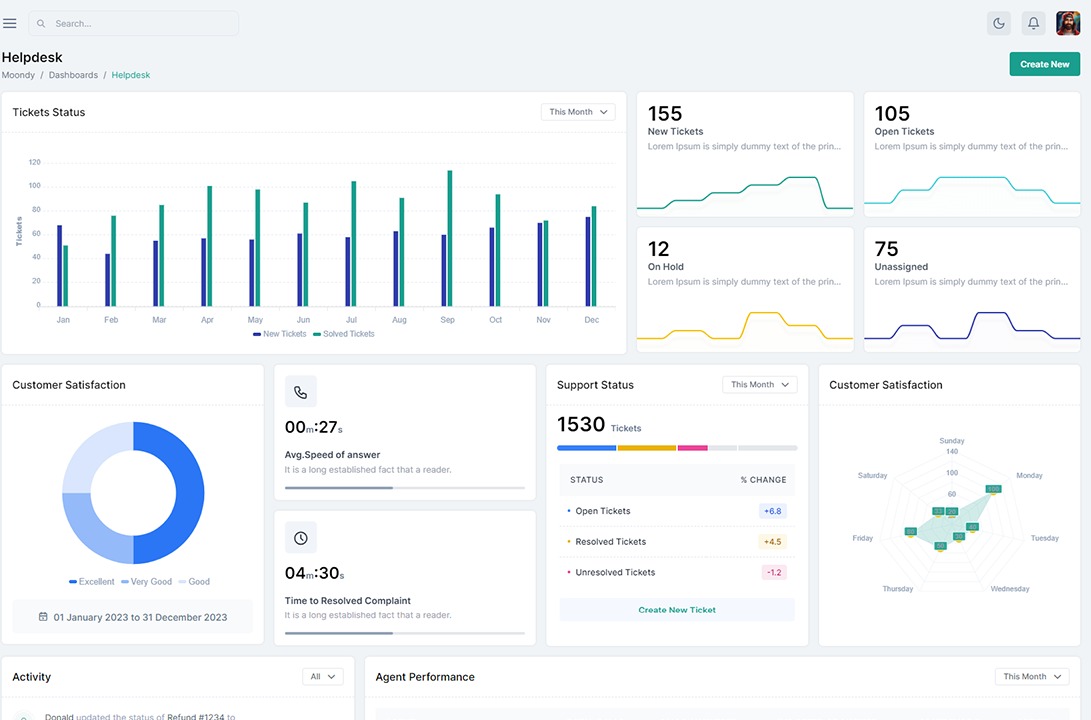
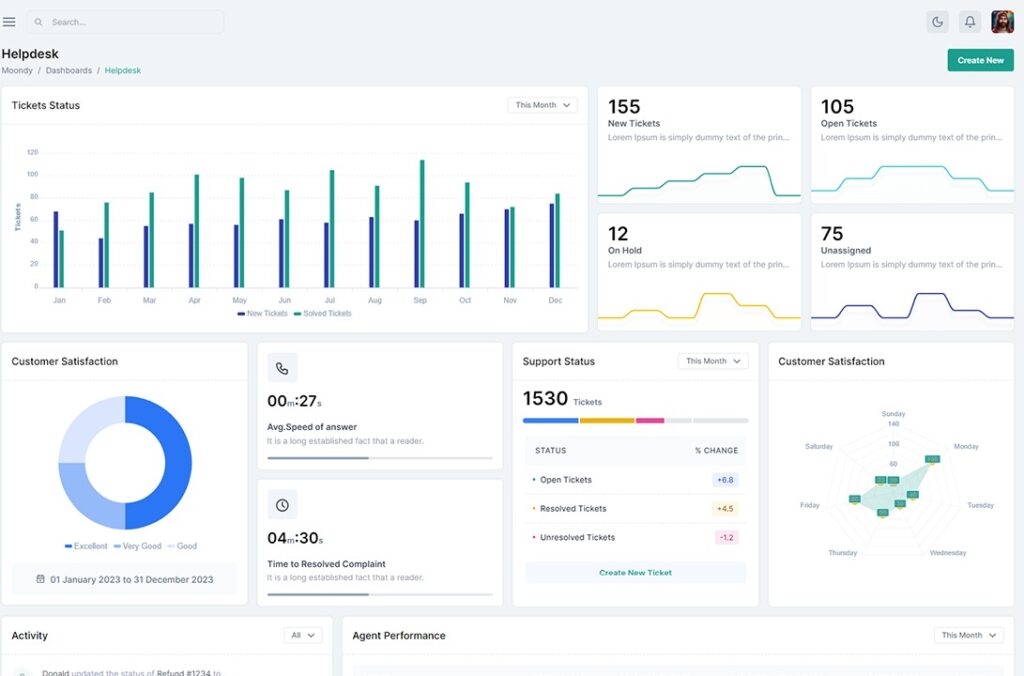
Customer support KPI dashboard Report:
This customer support report allows you to assess your overall Help Desk performance and efficiency of individual customer service agents. You can integrate it with any CRM software and pull up a variety of metrics from leads and conversations to average handle time and customer satisfaction. You can use these data points and collate them into useful and actionable KPIs for your KPI report.
SEO Report :
This SEO report will help you track organic search performance in Google by showing you how your site is performing in search results. You’ll also see the changes in that performance by noting high-performing pages, keywords, and queries, as well as your average ranking.
An SEO report will help you identify which queries you should focus on, and you’ll be able to optimize search snippets to improve your CTR from search results. The key metrics are impressions, clicks, costs, clicks by queries, pages by clicks, position, and crawl errors.
Employee performance dashboard:
By tracking key metrics like hours tracked, billable hours, and billing amounts, you’ll be able to visualize the data from Harvest in the way you want. The report will allow you to split tracked time by project, team, task, or client. It makes it easy to see how many hours have been tracked on a monthly, quarterly, and annual basis.
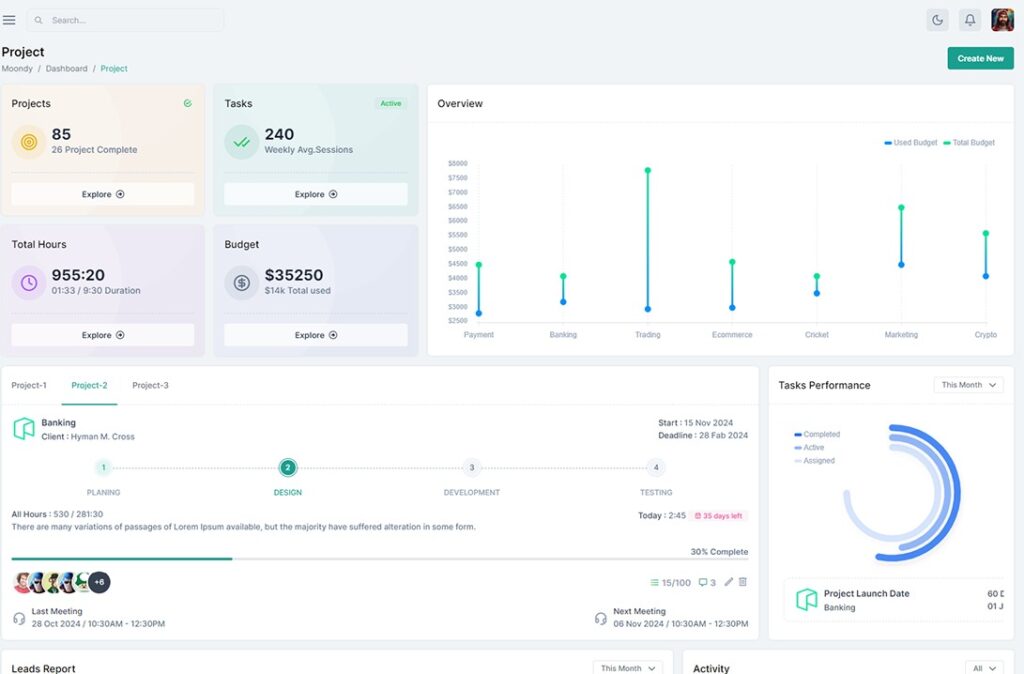
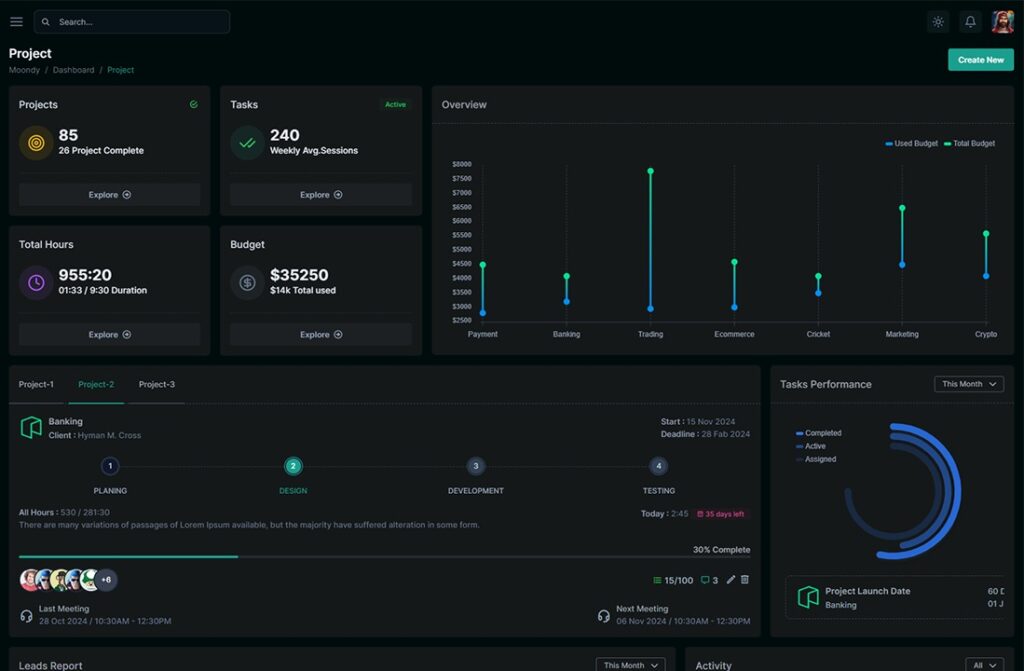
Project Management KPI report:
Project management KPIs are possibly the most important for the long-term health of any organization. If you connect a dashboard to your work management software, you’ll be able to keep your workflow organized and track your team’s progress very easily.
With a project management report, you’ll be able to monitor relevant metrics related to task organization like assigned tasks, overdue, completed, and assigned tasks, time spent on tasks, team performance and productivity, and many more.
Social media Report:
This will give you insights into how your social media campaign is progressing by tracking metrics like impressions, reach, followers, and more. If you want to track the performance of your business Instagram account, you’ll be able to see what posts have been popular with your followers, see the impact of your activity, and communicate how social media strategy is impacting the overall ROI.
Financial KPI Report:
A well-made financial reporting dashboard will give you insight into your business’ bank accounts, cash flows, sales, expenses, etc. You can use them to track your company’s financial transactions, open and unpaid invoices, debits and credits, and many more metrics thus easy cash flow projections.
Reasons Why Dashboards Are Important:
The major benefit of dashboard reporting is increased efficiency that’s to say be it process efficiency, operational efficiency, and return on investment.
The more you use dashboards and integrate them into your company’s workflows and processes, the more likely you will reap additional business benefits.
- Improved communication
- Saved time
- Improved data knowledge and understanding
- Increased productivity
- Saved money
- Reduced work interruptions
- Allowed visibility into the business
How to Bizzyeasy Dashboard will help you improve business performance:
Real-Time Dashboard:
If you are spending time each week or month building custom reports from scratch, that’s time you are not spending actually doing the work that drives results. And, more often its assumed that custom reports can be read and then be forgotten about. That’s not the case with Bizzyeasy real-time dashboard.
Data Transparency:
Bizzyeasy dashboard promotes data transparency whereby every single person in your company can see how their work impacts the business.
Facilitates setting of more actionable goals:
As discussed earlier that Bizzyeasy real-time dashboard is readily accessible by every employee at any time, this means most employees look at them more thus reminding them to set, reflect and fine goals more regularly.
Improves team communication:
An added benefit of increased accountability is improved communication. If everyone can see how each other’s efforts impact the company, they are going to be incentivized to communicate with one another instead of creating siloes.
Tasks Automation:
Bizzyeasy dashboard is time saving through the use of the embedded Automation element.
Faster Data Analysis:
Data is critical to making decisions, especially in the world of Performance Marketing, when things change by the second, but with Bizzyeasy, it is so much easier to analyze your data, spot trends, and patterns, and take action on what you learn.
Conclusion:
Can you believe it’s all found in one place, a single dashboard? Actually, you can test your own dashboard and see for yourself: sign up for a free trial today.